
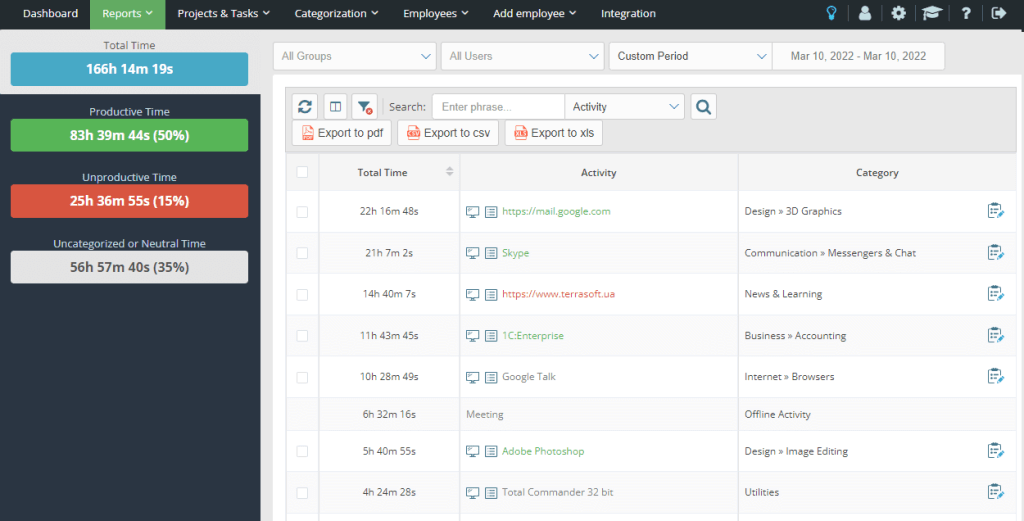
Every day, countless productive hours vanish from your organization without a trace. While teams appear busy, the actual output often tells a different story. The most dangerous productivity killers aren't obvious – they're the subtle, normalized behaviors that nobody questions anymore.
1. The Never-Ending Meeting Cycle
Meetings have become your team's default mode of operation. Calendar blocks grow ever larger while deliverables shrink. Team members nod politely through discussions, but weeks later, the same topics resurface. The meeting culture has created an illusion of progress while actually preventing real work from happening.
What to Analyze:
- Meeting-to-action ratio in time logs
- Total hours consumed by recurring meetings
- Participation distribution (who speaks vs. who listens)
- Post-meeting productivity metrics
How TimeTracker helps:
The Meeting Efficiency Module can identify which meetings consistently produce deliverables and which are merely time sinks. Implement a meeting ROI score by tracking time investment against resulting actions. Many organizations discover they can eliminate up to 30% of meeting time without any negative impact on productivity.
2. The Perpetual Deadline Extension Pattern
Your team has normalized missing deadlines. What was once an emergency has become routine, with projects consistently delivered days or weeks late. Worse, the initial time estimates keep shrinking (to appear more competitive) while actual delivery times expand, creating an ever-widening reality gap.
What to Analyze:
- Historical patterns of estimated vs. actual completion times
- Delay frequency by project type and team member
- Critical path interruptions and their causes
- Time distribution across project phases
Turn data into action:
Project Analytics reveals exactly where timeline breakdowns occur most frequently. The pattern recognition algorithm identifies which types of tasks are consistently underestimated, allowing for more accurate forecasting. Teams using data-backed estimation typically improve delivery accuracy by 40% within three months.
3. The Invisible Workload Imbalance
Some team members are drowning in assignments while others have capacity they aren't acknowledging. This imbalance remains hidden because there's no objective way to compare workloads, leading to burnout for some and disengagement for others.
What to Analyze:
- Individual capacity utilization rates
- Task complexity weighted against time allocation
- After-hours work patterns by team member
- Request-to-assignment conversion ratios
The data advantage:
Workload Equalization Dashboards provide real-time visibility into who's overutilized and who has bandwidth. The dynamic resource allocation tool helps redistribute tasks based on actual capacity rather than perceived availability, reducing both burnout and underutilization simultaneously.
4. The Multitasking Illusion
Team members juggle multiple priorities simultaneously, believing this demonstrates high productivity. In reality, constant context switching drains cognitive resources and extends task completion times, while the quality of output deteriorates.
What to Analyze:
- Context switching frequency throughout workday
- Correlation between task switching and error rates
- Focus session duration vs. output quality
- Interruption patterns and sources
Unlock focus potential:
Focus Analytics identifies optimal concentration periods for different team members and reveals the true cost of interruptions. Implementing protected deep work blocks based on personal productivity patterns can increase output quality by up to 60% while reducing overall time investment.
5. The Slow Burnout Progression
Your highest performers are quietly working longer hours each week. Their commitment appears admirable, but the data shows diminishing returns on those extra hours, signaling the early stages of burnout that will eventually lead to decreased performance or departure.
What to Analyze:
- Evening and weekend work patterns over time
- Productivity rate changes during extended work periods
- Vacation utilization patterns
- Work hour consistency vs. volatility
Prevent instead of react:
The Sustainability Index identifies unsustainable work patterns before they lead to burnout. The predictive modeling tool can forecast potential team member burnout weeks before traditional warning signs appear, allowing for preventive interventions rather than reactive responses.
Transform Data Into Organizational Advantage
The most successful teams don't just collect time data—they transform it into strategic insights that drive continuous improvement. By understanding these hidden patterns, managers can address productivity drains with precision rather than relying on gut feeling or outdated management theories.
Ready to uncover what's really happening with your team's time? Our complimentary productivity assessment gives you a glimpse into these insights without any commitment. See how your organization compares to industry benchmarks and discover your biggest opportunities for improvement. Start your journey toward data-driven productivity by registering for your free assessment today.

