Performance management evolved from annual reviews to continuous feedback, but many teams still rely on outdated reporting methods that provide insights weeks after problems occur. Real-time dashboards bridge this gap by offering immediate visibility into team dynamics, workload distribution, and productivity patterns. Instead of discovering bottlenecks during quarterly reviews, managers can identify and address issues while they're still manageable.
What is a real-time performance dashboard — and why teams need it
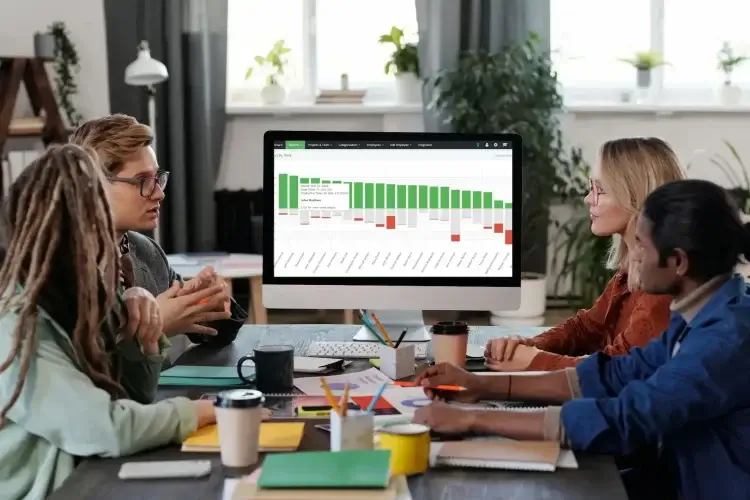
Traditional performance reports capture historical data that becomes outdated before teams can act on it. A real-time team performance dashboard displays current work patterns, active projects, and team capacity as events unfold. This immediate visibility enables proactive management rather than reactive problem-solving.
The fundamental shift involves moving from retrospective analysis to predictive insights.Research from Gallup shows that teams with continuous performance visibility demonstrate 23% higher engagement and 18% better productivity outcomes. Real-time data creates transparency that builds trust while providing managers the information needed for timely support.
Modern teams need this visibility because work patterns change rapidly. Project priorities shift, team members face unexpected challenges, and collaboration demands fluctuate throughout each week. Static reports miss these dynamic changes that significantly impact overall performance.
What should a real-time team dashboard track?
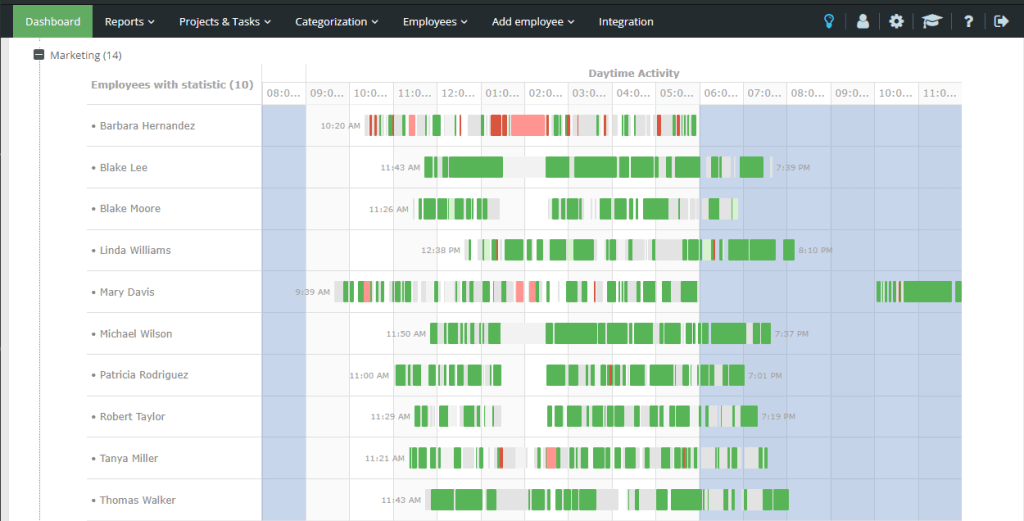
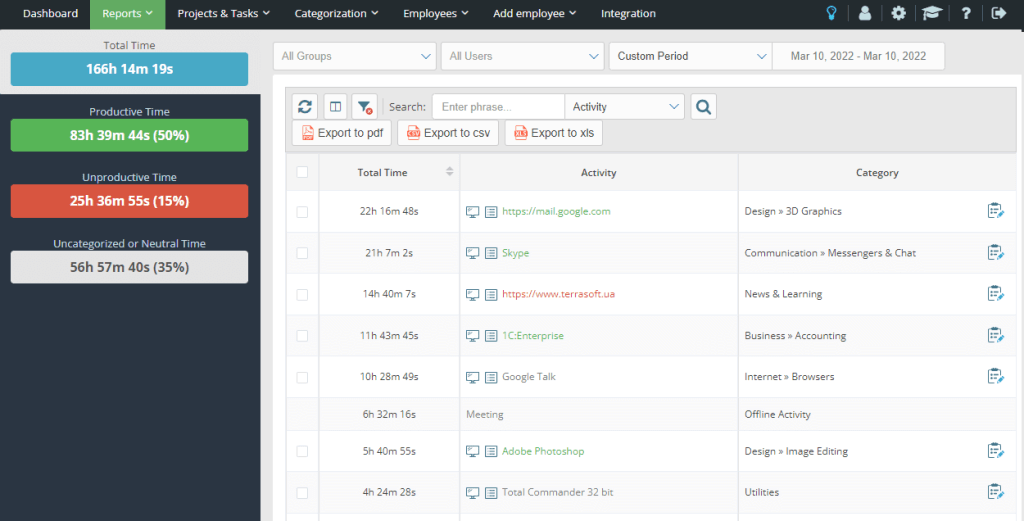
Effective employee productivity metrics fall into four core categories that together create a comprehensive view of team performance. Time usage patterns show when and how long team members engage with different tasks. Task flow metrics reveal how work moves through various stages and where delays occur.
Focus quality indicators measure deep work periods versus fragmented attention, while collaboration load tracks meeting time, communication overhead, and cross-team dependencies. Performance tracking tools should capture all four dimensions to avoid misleading conclusions based on incomplete data.
The most valuable dashboards integrate these categories into coherent narratives rather than displaying isolated numbers. Context matters more than raw metrics when interpreting team performance patterns.
Which metrics actually reflect performance, not just activity?
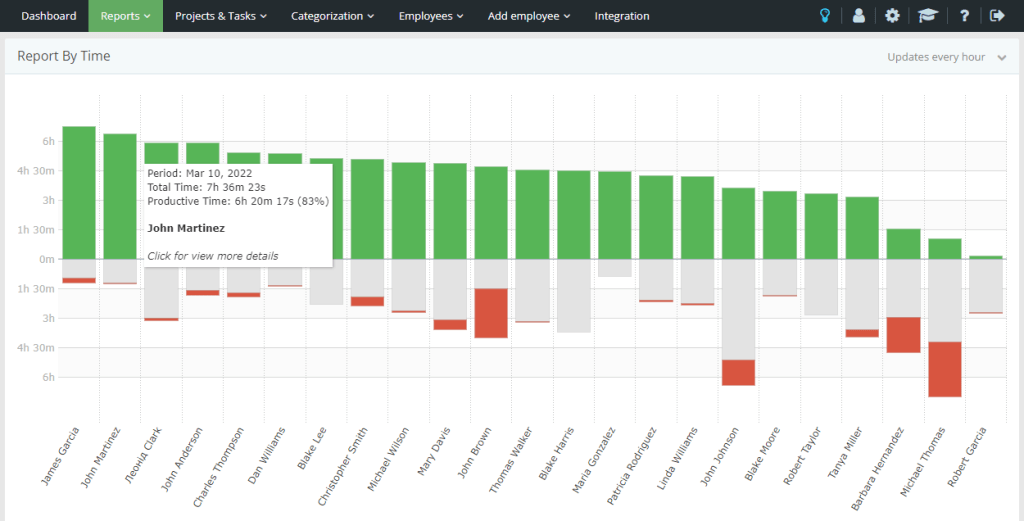
Raw activity measurements often mislead managers about actual productivity levels. Screen time, keystrokes, and application usage provide limited insight into work quality or meaningful contribution. Two team members might show identical activity levels while producing vastly different outcomes.
Harvard Business Review research demonstrates that outcome-based metrics correlate more strongly with business results than activity-based measurements. Focus on deliverable completion rates, quality scores, and goal achievement rather than time spent in specific applications.
Consider the difference between a developer debugging complex code for three hours versus someone attending back-to-back meetings. Both activities appear as sustained work in basic tracking systems, but they contribute differently to team objectives. Contextual team performance monitoring distinguishes between these scenarios through intelligent categorization and outcome tracking.
Real-world use cases of real-time dashboards
Organizations across different industries leverage performance dashboards to make informed decisions about resource allocation, workflow optimization, and team support. These applications demonstrate how real-time visibility translates into tangible improvements in both productivity and employee satisfaction.
Five ways companies use dashboards to drive decisions:
- Workload rebalancing – Identifying when team members approach capacity limits and redistributing tasks before burnout occurs
- Meeting optimization – Tracking collaboration overhead and reducing unnecessary meetings that fragment focus time
- Skill development priorities – Spotting performance gaps that indicate training needs for specific team members or entire departments
- Project timeline adjustments – Using real completion rates to update deadlines and prevent scope creep from derailing deliverables
- Remote team coordination – Ensuring distributed team members maintain connection and productivity across different time zones
These use cases work because they focus on supporting team success rather than policing individual behavior. Time tracking dashboards become strategic tools rather than surveillance mechanisms when applied thoughtfully.
How to choose the right metrics for your team's workflow
Different team types require distinct performance indicators that align with their unique contribution patterns and success factors. Software development teams benefit from code deployment frequency, bug resolution rates, and feature completion metrics. Customer support teams need response time tracking, resolution quality scores, and customer satisfaction indicators.
Project management teams focus on milestone achievement, resource utilization, and stakeholder communication effectiveness. Sales teams require lead conversion tracking, pipeline velocity, and client relationship metrics. The key involves selecting indicators that directly connect to business outcomes rather than generic activity measurements.
Productivity KPIs should reflect what matters most for each team's specific objectives while maintaining consistency across similar roles. Avoid the temptation to track everything—focus on the five to seven metrics that provide the clearest insight into performance trends and improvement opportunities.
Mistakes to avoid when interpreting real-time data
Many managers sabotage their dashboard effectiveness through common interpretation errors that lead to poor decisions and damaged team relationships. Understanding these pitfalls helps leaders extract valuable insights while avoiding counterproductive responses to performance data.
Common misreads that lead to poor decisions:
- Treating fluctuations as trends – Reacting to daily variations instead of focusing on weekly or monthly patterns
- Ignoring external factors – Failing to consider client demands, technical issues, or personal circumstances that affect performance
- Comparing incomparable roles – Using identical metrics for different job functions that require distinct skill sets and work approaches
- Overvaluing quantity metrics – Prioritizing output volume over quality, innovation, or strategic thinking contributions
- Missing collaboration work – Underestimating time spent helping colleagues, mentoring, or participating in cross-team initiatives
These mistakes occur when organizations treat remote team reporting as automated management rather than data that requires human interpretation and contextual understanding.
How real-time visibility helps reduce burnout and overload
Proactive monitoring identifies stress patterns before they escalate into serious performance or health issues. Dashboard alerts can flag when team members exceed sustainable work hours, take insufficient breaks, or carry disproportionate meeting loads that fragment their focus time.
Early identification enables managers to intervene with support rather than criticism. For example, noticing that a team member has attended twelve meetings in two days allows for immediate schedule adjustment rather than waiting for that person to request help or show signs of exhaustion.
Work analytics in real time reveals systemic issues that affect multiple team members simultaneously. When several people show declining focus scores during the same period, it might indicate organizational changes, unclear priorities, or external pressures that require leadership attention rather than individual performance conversations.
From data to action — how to turn dashboards into actual improvement
Dashboard value comes from the conversations and decisions they enable, not the metrics themselves. Effective performance monitoring creates feedback loops where data informs team discussions about workflow optimization, goal adjustment, and support needs.
Regular team reviews should focus on trend analysis rather than individual accountability. Use dashboard insights to identify successful patterns that can be replicated and challenges that require collaborative problem-solving. Employee output tracking becomes a team resource rather than a management tool when everyone participates in interpreting and acting on the data.
The most successful implementations involve team members in selecting metrics, understanding measurement logic, and contributing to improvement strategies based on dashboard insights. This collaborative approach ensures that real-time visibility supports team success rather than creating surveillance anxiety.
Want a clear picture of how your team works—without guesswork? Try Yaware's real-time performance dashboard and turn raw data into real decisions. Register now at Yaware.com and get started.

